반응형
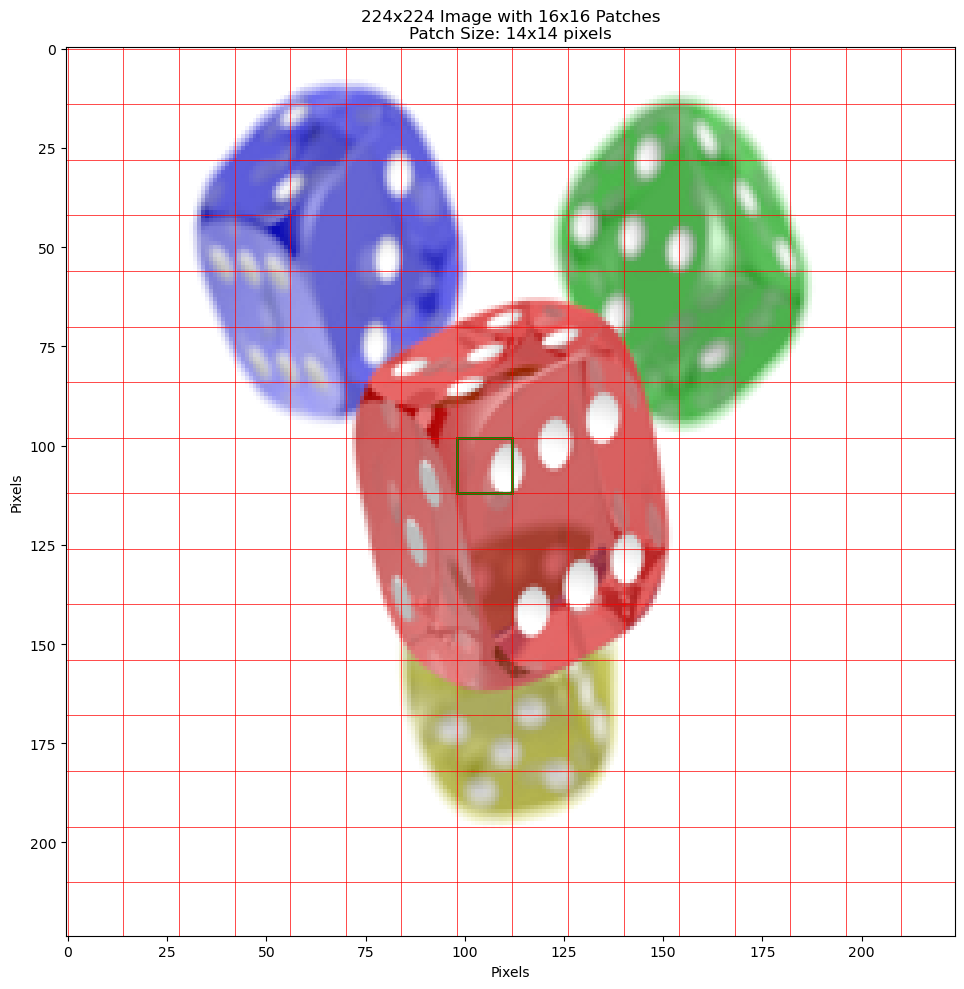
1. 이미지의 패치 단위 얼만큼 차지하는지 보는 코드
import matplotlib.pyplot as plt
import numpy as np
from PIL import Image
import requests
from io import BytesIO

# Image dimensions
img_size = 224
patch_size = 14
num_patches = 16


# Function to load and resize image
def load_and_resize_image(url, size):
    response = requests.get(url)
    img = Image.open(BytesIO(response.content))
    img = img.resize((size, size))
    return np.array(img)

# Load a sample image (replace with your own image URL if desired)
image_url = "https://upload.wikimedia.org/wikipedia/commons/thumb/4/47/PNG_transparency_demonstration_1.png/640px-PNG_transparency_demonstration_1.png"
img = load_and_resize_image(image_url, img_size)

# Create the plot
fig, ax = plt.subplots(figsize=(10, 10))

# Plot the image
ax.imshow(img, cmap='gray')

# Draw the grid
for i in range(0, img_size, patch_size):
    ax.axhline(y=i, color='r', linestyle='-', linewidth=0.5)
    ax.axvline(x=i, color='r', linestyle='-', linewidth=0.5)

# Highlight a single patch
highlight_patch = (7, 7)  # Change this to highlight different patches
start_x = highlight_patch[1] * patch_size
start_y = highlight_patch[0] * patch_size
rect = plt.Rectangle((start_x, start_y), patch_size, patch_size,
                     fill=False, edgecolor='green', linewidth=2)
ax.add_patch(rect)

# Add labels
ax.set_title(f'{img_size}x{img_size} Image with {num_patches}x{num_patches} Patches\nPatch Size: {patch_size}x{patch_size} pixels')
ax.set_xlabel('Pixels')
ax.set_ylabel('Pixels')

# Show the plot
plt.tight_layout()
plt.show()
224x224 이미지를 16x16 개의 patch로 구분하는 코드
결과
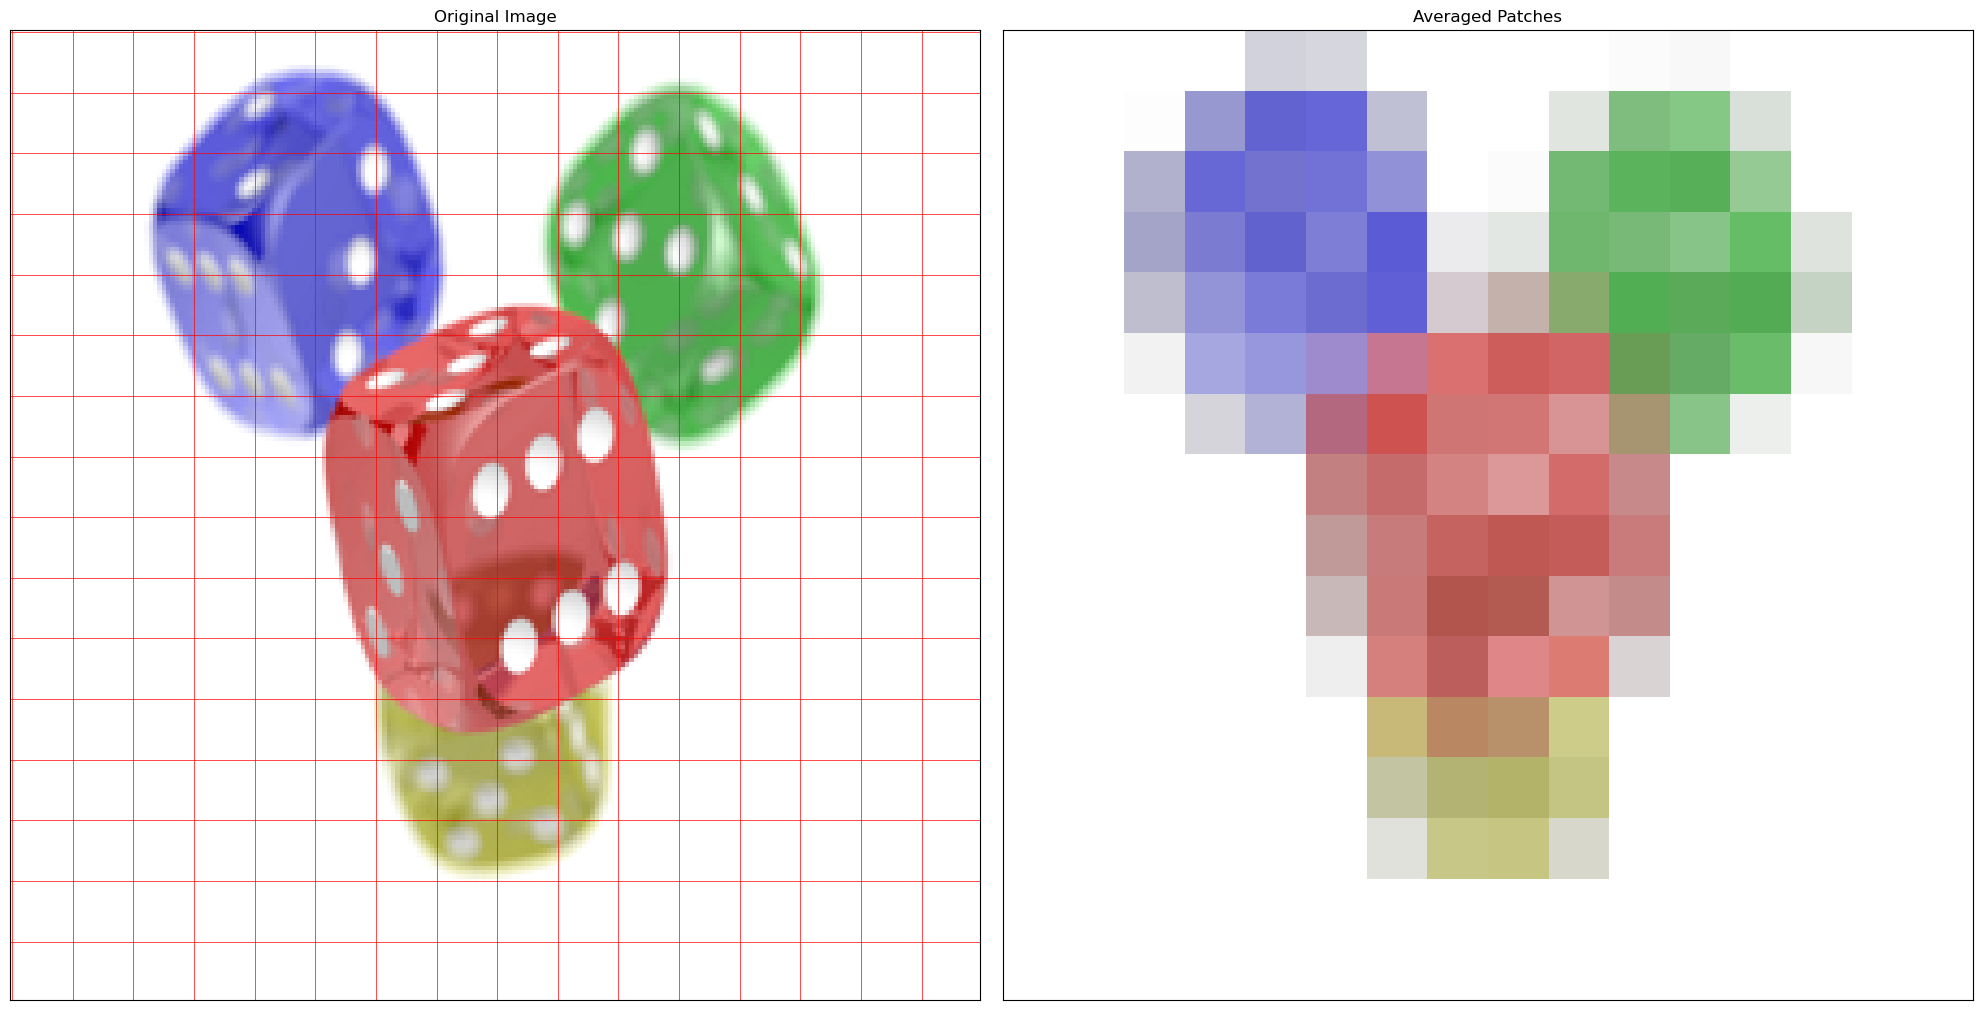
2. 다음으로 patch 하나를 average해서 보여주기
import matplotlib.pyplot as plt
import numpy as np
from PIL import Image
import requests
from io import BytesIO

# Image dimensions
img_size = 224
patch_size = 14
num_patches = 16

def load_and_resize_image(url, size):
    response = requests.get(url)
    img = Image.open(BytesIO(response.content))
    img = img.resize((size, size))
    return np.array(img)

def average_patches(img, patch_size):
    h, w, c = img.shape
    patches_h = h // patch_size
    patches_w = w // patch_size

    averaged = np.zeros((patches_h, patches_w, c), dtype=np.uint8)

    for i in range(patches_h):
        for j in range(patches_w):
            patch = img[i*patch_size:(i+1)*patch_size, j*patch_size:(j+1)*patch_size]
            averaged[i, j] = np.mean(patch, axis=(0, 1)).astype(np.uint8)

    return averaged

# Load a sample image (replace with your own image URL if desired)
image_url = "https://upload.wikimedia.org/wikipedia/commons/thumb/4/47/PNG_transparency_demonstration_1.png/640px-PNG_transparency_demonstration_1.png"
img = load_and_resize_image(image_url, img_size)

# Average the patches
averaged_img = average_patches(img, patch_size)

# Create the plot
fig, (ax1, ax2) = plt.subplots(1, 2, figsize=(20, 10))

# Plot the original image
ax1.imshow(img)
ax1.set_title('Original Image')

# Draw the grid on the original image
for i in range(0, img_size, patch_size):
    ax1.axhline(y=i, color='r', linestyle='-', linewidth=0.5)
    ax1.axvline(x=i, color='r', linestyle='-', linewidth=0.5)

# Plot the averaged image
ax2.imshow(averaged_img, interpolation='nearest')
ax2.set_title('Averaged Patches')

# Add labels and remove axis ticks
for ax in (ax1, ax2):
    ax.set_xticks([])
    ax.set_yticks([])

# Show the plot
plt.tight_layout()
plt.show()

# Save the averaged image
averaged_pil = Image.fromarray(averaged_img)
averaged_pil.save('averaged_patches.png')
print("Averaged image saved as 'averaged_patches.png'")
224x224 이미지를 16x16 개의 patch로 구분하고, 그 패치 안의 rgb value를 평균내서 시각화하는 코드
End.
반응형
'Deep learning' 카테고리의 다른 글
| Overleaf column width figure 너비 / cm 단위 저장 (0) | 2024.10.15 |
|---|---|
| 이미지 normalize의 중요성 / clamp(0, 1) (0) | 2024.07.31 |
| Imagenet에서 이미지 생성 / class-conditional과 resolution task (1) | 2024.04.18 |
| 대규모 언어모델의 Training compute / 구성요소 (0) | 2024.04.18 |
| Take home message에 대해서 (0) | 2024.04.18 |


